Trend trading, also known as trend following, is a strategy that involves identifying the overall market direction and trading in line with it. Traders look for established upward or downward price movements and aim to ride those trends for as long as possible.
Using technical tools like moving averages (MA), trendlines, and momentum indicators, trend traders analyse charts, identify support and resistance zones, and determine entry/exit points. A long position is taken when the market trends upward, while a short position is preferred during downward trends.
Key Takeaways
Definition: Trend trading is about aligning trades with prevailing market momentum.
Tools: Moving averages, trendlines, RSI, MACD, and stochastic oscillators.
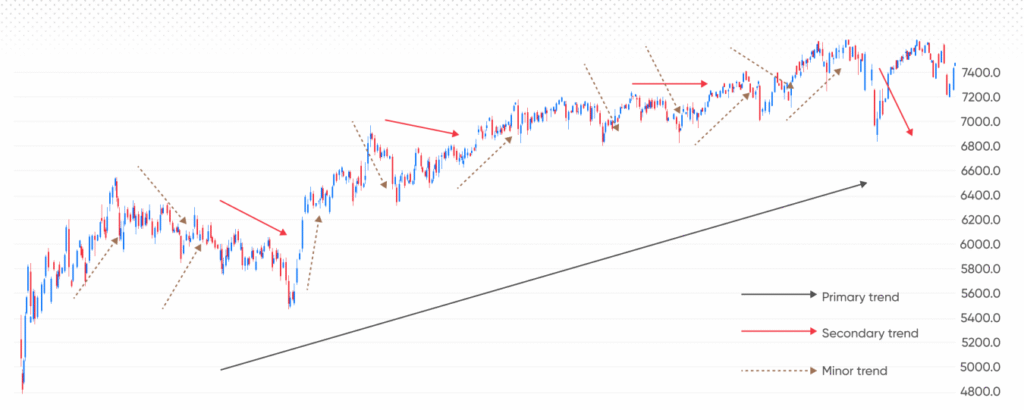
Types of trends: Secular, primary, secondary, intermediate, and minor.
Markets: Works across stocks, forex, crypto, commodities, and indices.
Risks: Includes false signals, lagging indicators, and sudden reversals.
A Famous Example: The Turtle Traders
In the 1980s, commodities trader Richard Dennis proved trend trading could be taught through his “Turtle Experiment.” He trained novices with his rules-based trend-following system. Collectively, the group generated massive profits, with some members—like Jerry Parker and Paul Rabar—later founding highly successful trading firms.
This case study demonstrated that disciplined application of trend-trading principles can yield strong results.
Types of Trends
Secular trends: Long-term, lasting decades, often driven by structural or demographic changes.
Primary trends: Mid-to-long term, lasting months or years, usually influenced by economic cycles.
Secondary trends: Shorter-term, lasting weeks to months, often tied to sentiment shifts.
Intermediate trends: Days to weeks, influenced by demand/supply dynamics.
Minor trends: Lasting a few days; often exploited by swing and day traders.
Common Trend-Trading Strategies
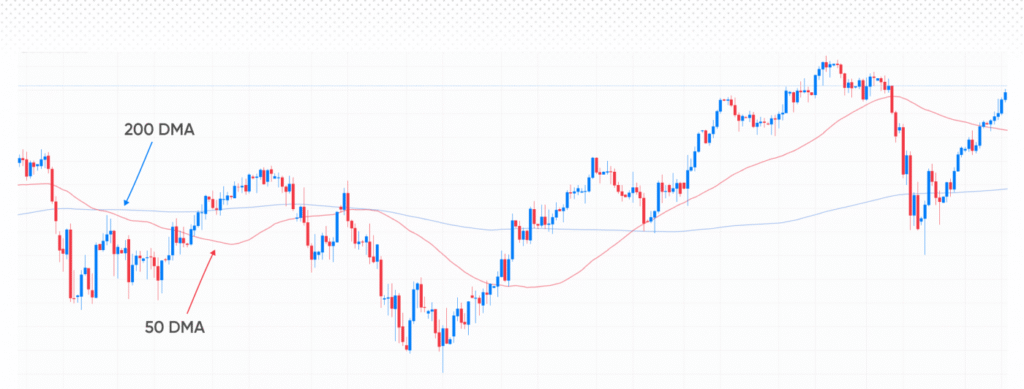
1. Moving Averages
The moving average (MA) indicator calculates the average price of an asset over a specific period. A popular signal is the “golden cross”, which occurs when a short-term moving average (e.g., 50-day) rises above a long-term moving average (e.g., 200-day). This is typically viewed as a bullish signal, suggesting that the trend may be turning upward.
Past performance is not a reliable indicator of future results.
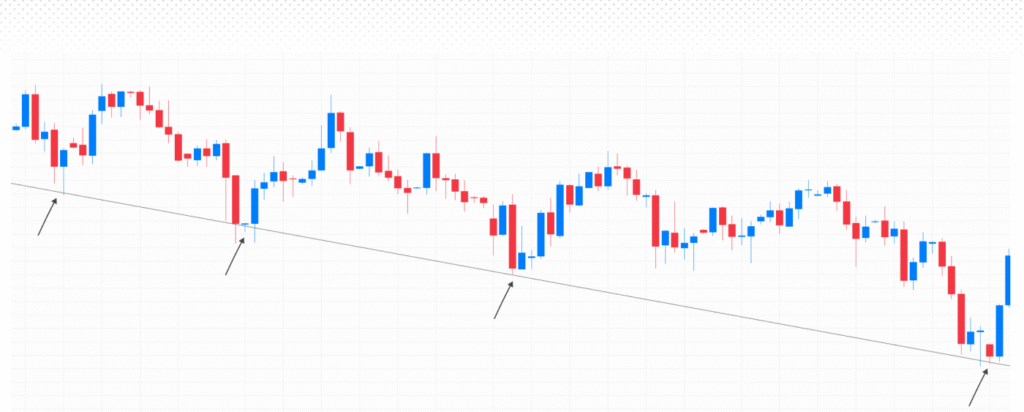
2. Trendlines
Trend lines are straight lines drawn across two or more price points, connecting highs or lows to show the direction and slope of a trend. They help traders identify the overall direction of the market and can be used alongside other technical tools. For instance, a bullish chart pattern like a double bottom forming near an uptrend line may suggest strengthening bullish momentum.
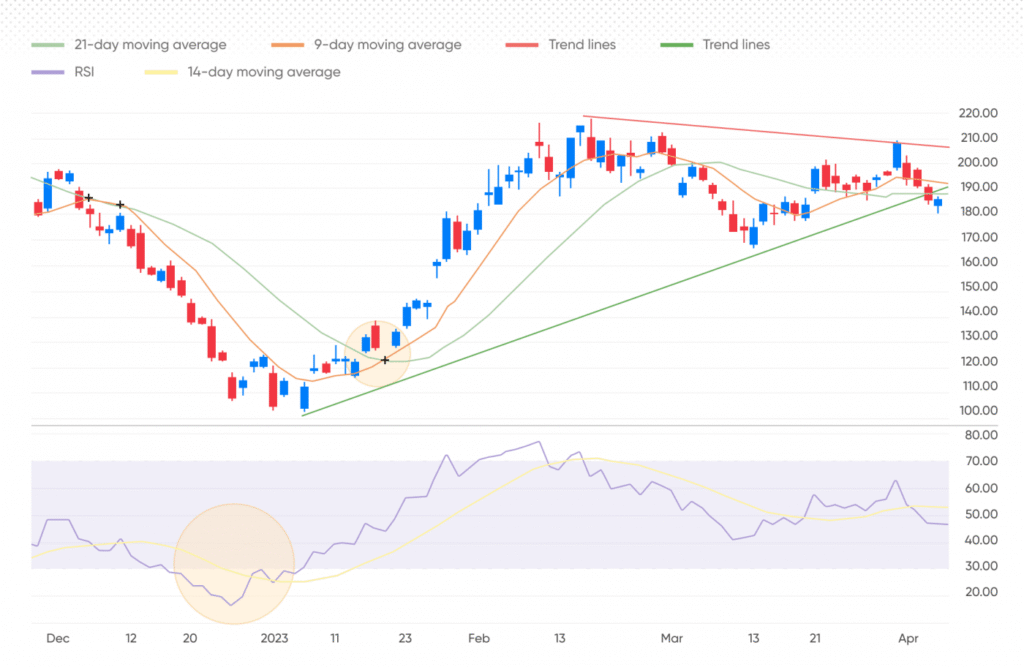
3. Momentum Indicators
Momentum indicators measure the strength of a trend and help traders find possible entry and exit opportunities. Commonly used indicators include:
Relative Strength Index (RSI): Ranges from 0 to 100, indicating overbought conditions above 70 and oversold conditions below 30.
Moving Average Convergence Divergence (MACD): A trend-following momentum tool with two lines (MACD line and signal line). A bullish signal occurs when the MACD line crosses above the signal line, while a bearish signal occurs when it crosses below.
Stochastic Oscillator: Compares an asset’s closing price to its recent trading range. Like the RSI, it highlights overbought and oversold conditions.
Why Choose Trend Trading?
Adaptability: Works across multiple markets and timeframes.
Momentum-based: Helps traders capitalise on clear market direction.
Scalable: Suitable for both short-term and long-term approaches.
Risks of Trend Trading
False signals: Markets may appear to trend but reverse quickly.
Lagging indicators: By the time a signal appears, part of the move may already be gone.
Trend reversals: Sudden shifts can lead to losses if positions aren’t managed.
Getting Started with Trend Trading
Identify trends using charts and technical indicators.
Set entry and exit points with confirmation tools like RSI or MACD.
Apply risk management with stop-losses and proper position sizing.
Test strategies using backtesting and demo trading before committing capital.
Conclusion
Trend trading is one of the most versatile and widely practiced strategies, enabling traders to profit by following market direction rather than fighting it. By using tools such as moving averages, trendlines, and momentum indicators, traders can spot and capitalise on sustained trends across multiple markets.
However, risks such as false signals and sudden reversals mean discipline and sound risk management are essential.
Want to improve your trading mindset? Talk to an expert at Imperial Strategies today and start mastering your trading psychology.